EXPLAIN
EXPLAIN is used to provide the execution plan of a statement.
Syntax
EXPLAIN [ANALYZE] SELECT ...EXPLAIN [ANALYZE] SELECT ...The ANALYZE clause will execute the statement and measure time spent at each plan node and the total rows of the output etc.
Examples
Explains the following query:
EXPLAIN SELECT * FROM monitor where host='host1';EXPLAIN SELECT * FROM monitor where host='host1';| plan_type | plan
| logical_plan | Projection: monitor.host, monitor.ts, monitor.cpu, monitor.memory
Filter: monitor.host = Utf8("host1")
TableScan: monitor projection=[host, ts, cpu, memory], partial_filters=[monitor.host = Utf8("host1")] |
| physical_plan | ProjectionExec: expr=[host@0 as host, ts@1 as ts, cpu@2 as cpu, memory@3 as memory]
CoalesceBatchesExec: target_batch_size=4096
FilterExec: host@0 = host1
RepartitionExec: partitioning=RoundRobinBatch(10)
ExecutionPlan(PlaceHolder)| plan_type | plan
| logical_plan | Projection: monitor.host, monitor.ts, monitor.cpu, monitor.memory
Filter: monitor.host = Utf8("host1")
TableScan: monitor projection=[host, ts, cpu, memory], partial_filters=[monitor.host = Utf8("host1")] |
| physical_plan | ProjectionExec: expr=[host@0 as host, ts@1 as ts, cpu@2 as cpu, memory@3 as memory]
CoalesceBatchesExec: target_batch_size=4096
FilterExec: host@0 = host1
RepartitionExec: partitioning=RoundRobinBatch(10)
ExecutionPlan(PlaceHolder)The column plan_type indicates whether it's alogical_plan or physical_plan. And the column plan explains the plan in detail.
Explains the execution of the plan by ANALYZE:
EXPLAIN ANALYZE SELECT * FROM monitor where host='host1'\GEXPLAIN ANALYZE SELECT * FROM monitor where host='host1'\G*************************** 1. row ***************************
stage: 0
node: 0
plan: MergeScanExec: peers=[5471788335104(1274, 0), 5471788335105(1274, 1), ] metrics=[output_rows: 0, greptime_exec_read_cost: 0, finish_time: 1496211, ready_time: 846828, first_consume_time: 1491941, ]
*************************** 2. row ***************************
stage: 1
node: 0
plan: CoalesceBatchesExec: target_batch_size=8192 metrics=[output_rows: 0, elapsed_compute: 4147, ]
FilterExec: host@2 = host1 metrics=[output_rows: 0, elapsed_compute: 32, ]
RepartitionExec: partitioning=RoundRobinBatch(32), input_partitions=8 metrics=[repart_time: 8, fetch_time: 230515, send_time: 256, ]
SeqScan: region=5471788335105(1274, 1), partition_count=0 (0 memtable ranges, 0 file ranges) metrics=[output_rows: 0, mem_used: 0, ]
*************************** 3. row ***************************
stage: 1
node: 1
plan: CoalesceBatchesExec: target_batch_size=8192 metrics=[output_rows: 0, elapsed_compute: 3660, ]
FilterExec: host@2 = host1 metrics=[output_rows: 0, elapsed_compute: 32, ]
RepartitionExec: partitioning=RoundRobinBatch(32), input_partitions=8 metrics=[repart_time: 8, fetch_time: 113774, send_time: 256, ]
SeqScan: region=5471788335104(1274, 0), partition_count=0 (0 memtable ranges, 0 file ranges) metrics=[output_rows: 0, mem_used: 0, ]
*************************** 4. row ***************************
stage: NULL
node: NULL
plan: Total rows: 0
4 rows in set (0.002 sec)*************************** 1. row ***************************
stage: 0
node: 0
plan: MergeScanExec: peers=[5471788335104(1274, 0), 5471788335105(1274, 1), ] metrics=[output_rows: 0, greptime_exec_read_cost: 0, finish_time: 1496211, ready_time: 846828, first_consume_time: 1491941, ]
*************************** 2. row ***************************
stage: 1
node: 0
plan: CoalesceBatchesExec: target_batch_size=8192 metrics=[output_rows: 0, elapsed_compute: 4147, ]
FilterExec: host@2 = host1 metrics=[output_rows: 0, elapsed_compute: 32, ]
RepartitionExec: partitioning=RoundRobinBatch(32), input_partitions=8 metrics=[repart_time: 8, fetch_time: 230515, send_time: 256, ]
SeqScan: region=5471788335105(1274, 1), partition_count=0 (0 memtable ranges, 0 file ranges) metrics=[output_rows: 0, mem_used: 0, ]
*************************** 3. row ***************************
stage: 1
node: 1
plan: CoalesceBatchesExec: target_batch_size=8192 metrics=[output_rows: 0, elapsed_compute: 3660, ]
FilterExec: host@2 = host1 metrics=[output_rows: 0, elapsed_compute: 32, ]
RepartitionExec: partitioning=RoundRobinBatch(32), input_partitions=8 metrics=[repart_time: 8, fetch_time: 113774, send_time: 256, ]
SeqScan: region=5471788335104(1274, 0), partition_count=0 (0 memtable ranges, 0 file ranges) metrics=[output_rows: 0, mem_used: 0, ]
*************************** 4. row ***************************
stage: NULL
node: NULL
plan: Total rows: 0
4 rows in set (0.002 sec)In above example, we got 4 rows of output. Except the last row gives an overall summary, each remains row represents a staged node of the execution plan. The stage column indicates the stage number, and the node column indicates the node number. The plan column explains the plan and related metrics in detail.
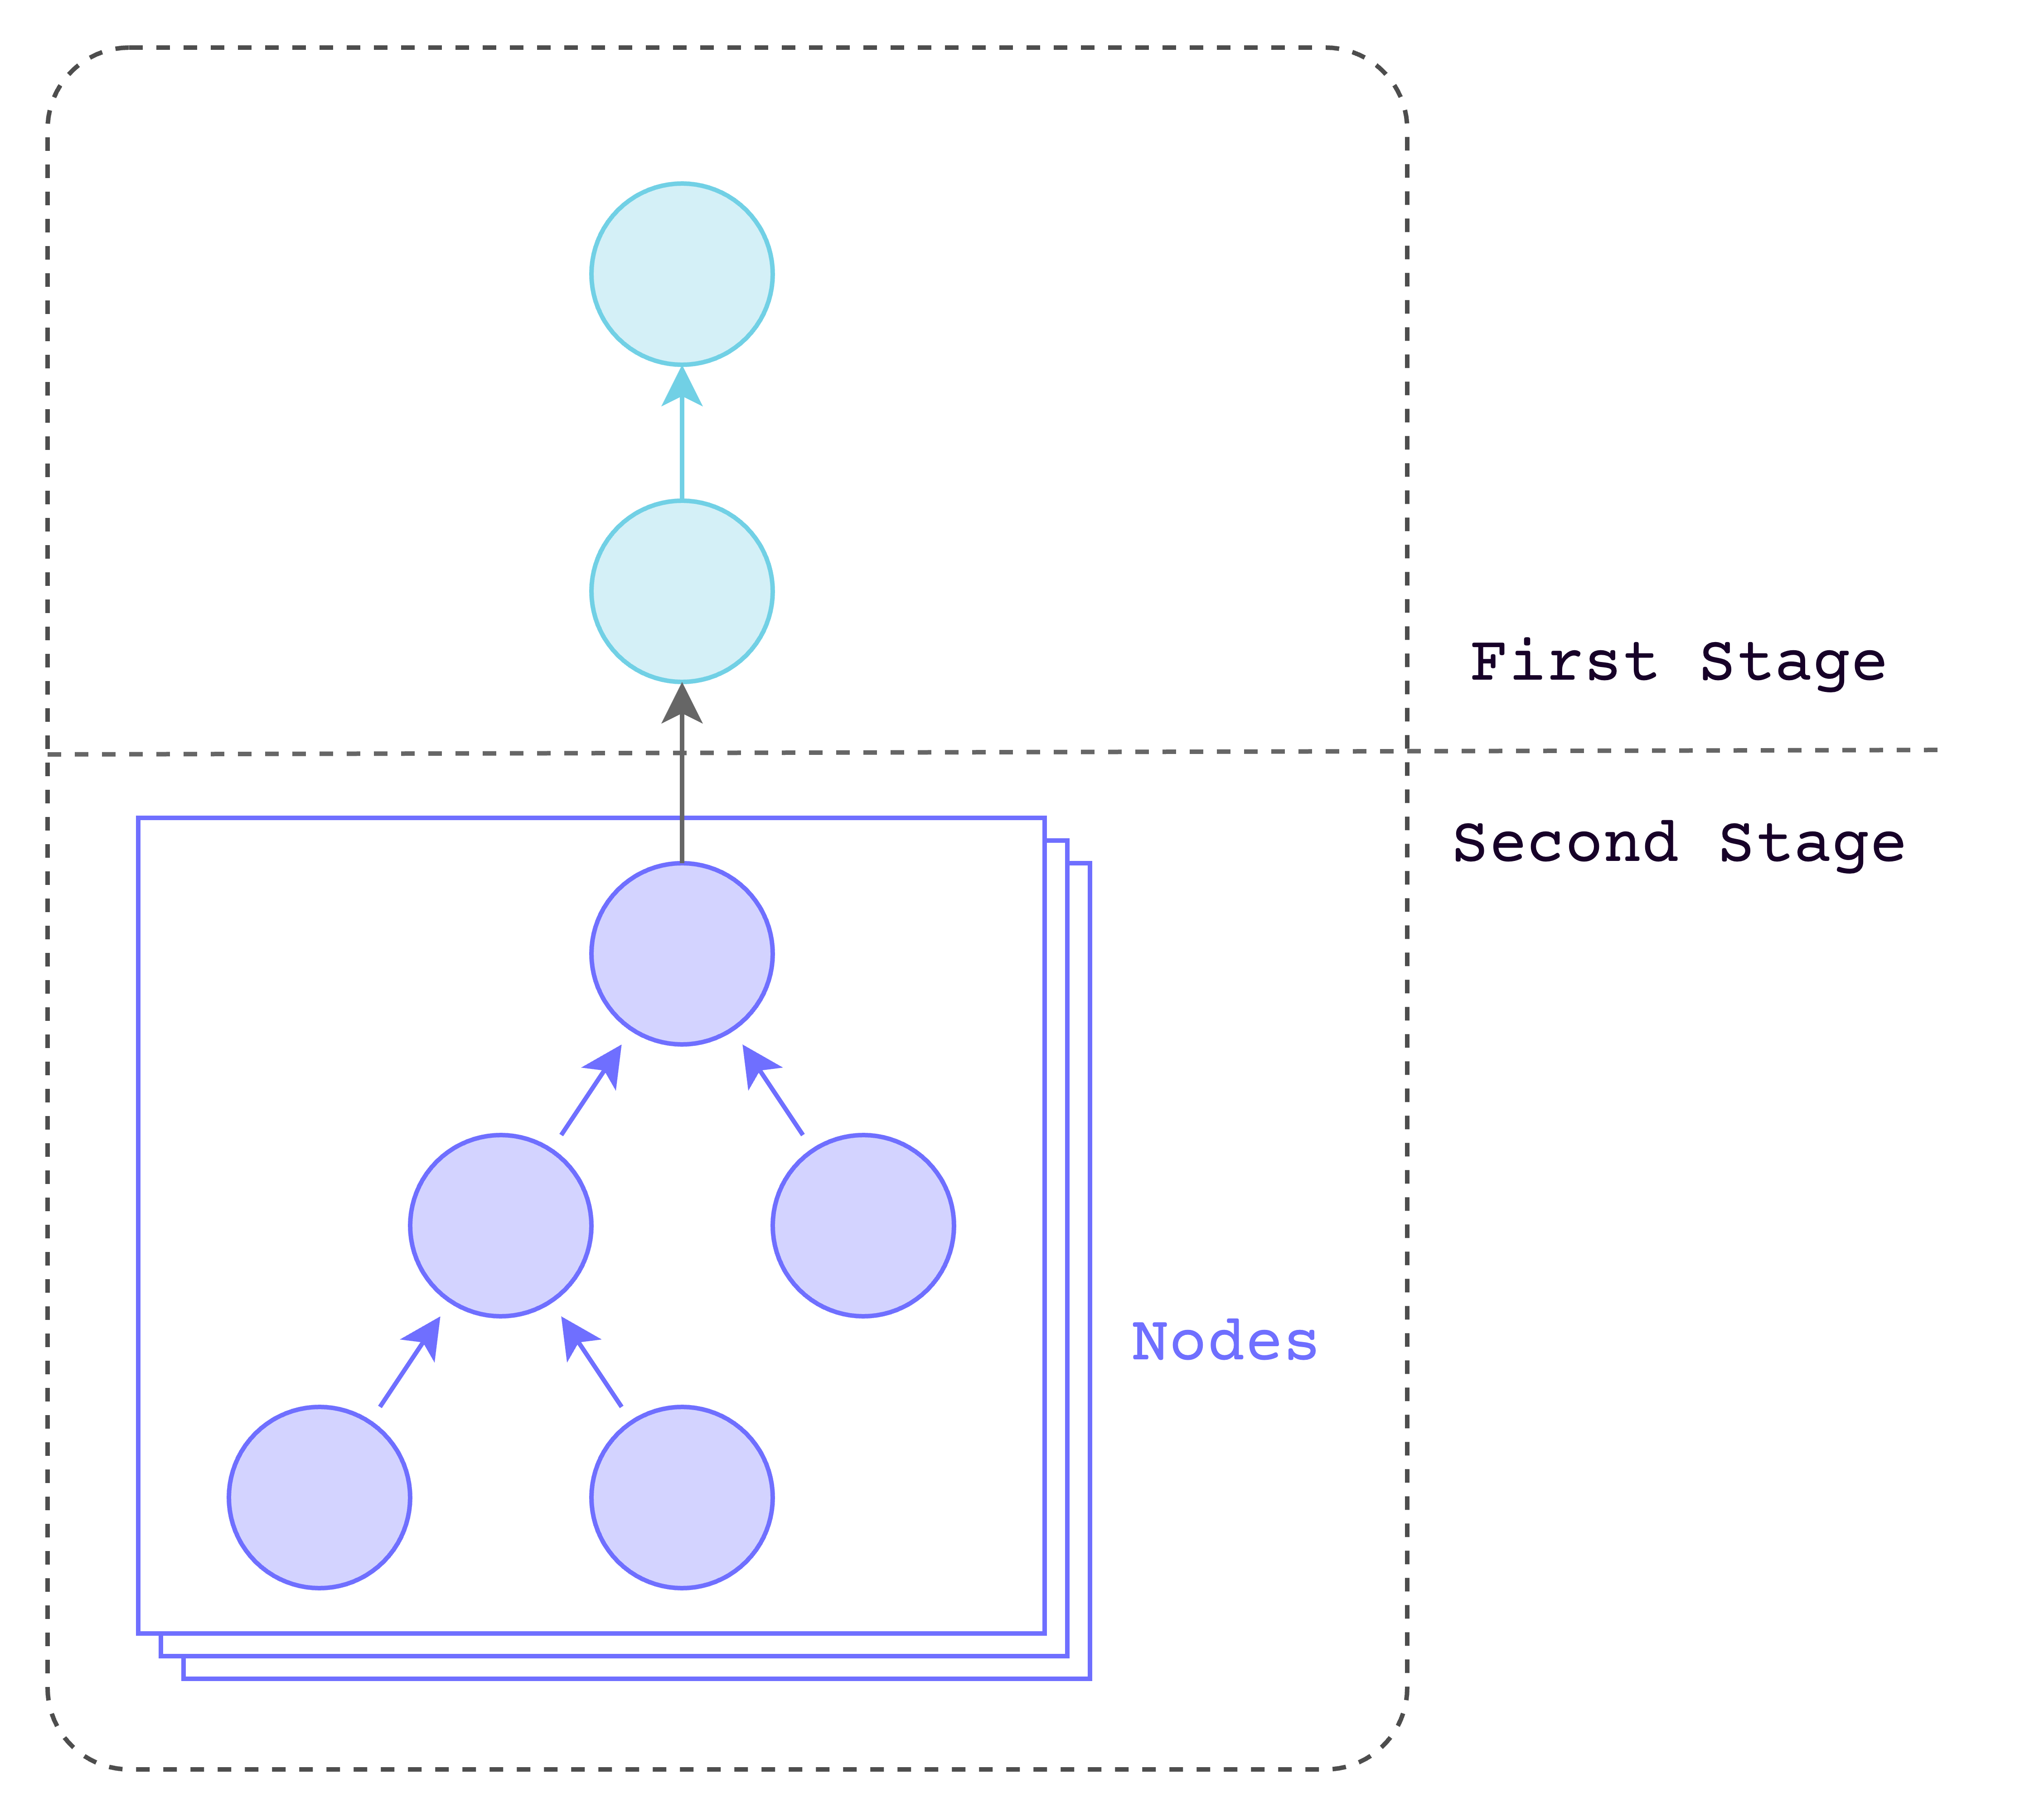
Stage and node
This example is based on a distributed partition table with two regions. We mark different "stage" in a distributed execution plan with stage number, start from 0. And in each stage, we may have multiple "node" to execute the plan in parallel. The node number also starts from 0 in each stage. These two words are only used here currently. Here is an example about 3 "node" with 2 "stage":